Office of Institutional Effectiveness Outcomes
Student Achievement Information
Overall ESU Information
UNDERGRADUATE FIRST-TIME FULL-TIME FRESHMAN STUDENT - Retention Rates |
|||||
| COHORT | 1st Term | 1st Year | 3rd Term | 2nd Year | 3rd Year |
| 2016 | 90.6% | 73.2% | 68.6% | 60.5% | 51.1% |
| 2017 | 88.9% | 74.8% | 69.7% | 63.2% | 52.6% |
| 2018 | 89.9% | 76.7% | 72.0% | 66.2% | 58.2% |
| 2019 | 91.0% | 77.6% | 73.2% | 66.8% | 55.0% |
| 2020 | 87.5% | 73.7% | 69.8% | 60.5% | 50.7% |
| 2021 | 90.3% | 71.6% | 63.6% | 56.0% | |
| 2022 | 85.8% | 68.9% | 63.0% | ||
| 2023 | 89.7% | ||||
| 5-Year Average | 88.9% | 73.7% | 69.7% | 62.5% | 53.5% |
1. Cohorts defined as reported to IPEDS and include all First-Time Full-Time Undergraduate Students. |
UNDERGRADUATE FIRST-TIME FULL-TIME FRESHMAN STUDENT COHORTS - Graduation Rates
|
|||||
| Cohort Year | 4-Year | 6-Year | |||
| 2012 | 26% | 45% | |||
| 2013 | 29% | 50% | |||
| 2014 | 27% | 46% | |||
| 2015 | 32% | 50% | |||
| 2016 | 35% | 52% | |||
| 2017 | 38% | 54% | |||
| 2018 | 40% | ||||
| 2019 | 39% | ||||
|
1. Cohorts defined as reported to IPEDS and include all First-Time Full-Time Undergraduate Students. |
|||||
UNDERGRADUATE TRANSFER STUDENT - Retention Rates
|
|||||
| COHORT | 1st Term | 1st Year | 3rd Term | ||
| 2016 | 89.7% | 78.3% | 71.7% | ||
| 2017 | 90.5% | 80.2% | 49.3% | ||
| 2018 | 91.1% | 77.2% | 71.8% | ||
| 2019 | 91.9% | 81.1% | 72.6% | ||
| 2020 | 87.2% | 75.1% | 71.3% | ||
| 2021 | 87.8% | 72.3% | 64.2% | ||
| 2022 | 87.2% | 75.9% | 65.9% | ||
| 2023 | 86.7% | ||||
| 5-Year Average | 89.0% | 77.2% | 71.4% |
1. Transfer Student cohorts include all New Transfer students entering for the first time during the fall semester. |
|
UNDERGRADUATE TRANSFER STUDENT Graduation Rates |
|||||
| COHORT | 2-Year | 3-Year | 4-Year | ||
| 2016 | 17.7% | 47.7% | 57.7% | ||
| 2017 | 22.6% | 49.9% | 62.2% | ||
| 2018 | 22.1% | 49.7% | 65.8% | ||
| 2019 | 20.6% | 56.4% | |||
| 2020 | 38.9% | ||||
| 2021 | |||||
| Trend Average | 24.4% | 50.9% | 61.9% |
1. Transfer Student cohorts include all New Transfer students entering for the first time during the fall semester. |
|
GRADUATE STUDENT COHORTS - Graduation Rates
|
|||||
| Cohort Year | 3-Year | 4-Year | 5-Year | 6-Year | 7-Year |
| 2014 | 53% | 68% | 73% | 75% | 77% |
| 2015 | 55% | 69% | 73% | 76% | 77% |
| 2016 | 72% | 78% | 81% | 83% | |
| 2017 | 74% | 80% | 83% | ||
| 2018 | 70% | 77% | 81% | ||
| 2019 | 77% | 80% | |||
| 2020 | 73% | ||||
|
1. Graduate Student cohorts include all New students entering for the first time during the academic year. 2. Completion Rates calculated for Graduate students are determined by counting terms accumulated from first term of entry (1-year = summer+fall+spring terms). |
|||||
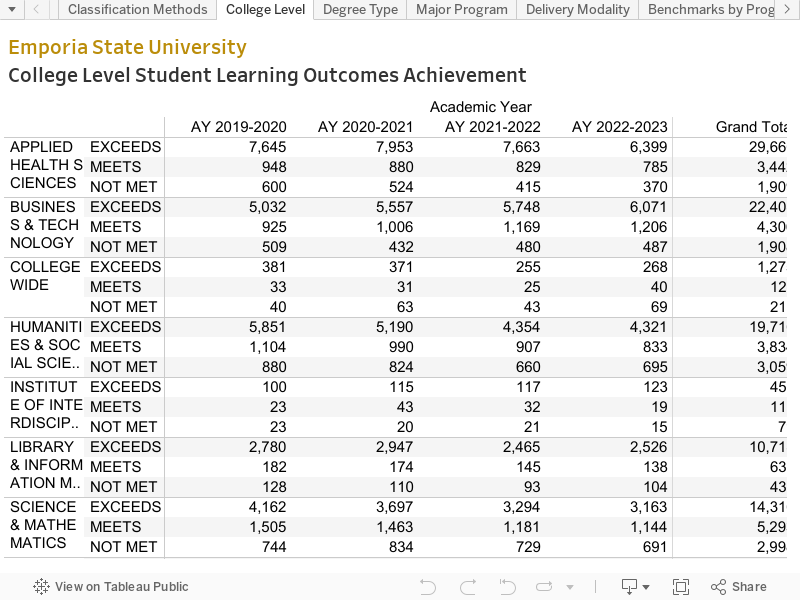
Emporia State University measures student achievement in many ways and at multiple levels. The table visualizations shown below can be selected as tabs at the top of the display. The metrics shown categorize numerical achievement by College, Degree Type, Major Program, and Delivery Modality. In addition, there are benchmark achievement percentages by Program, Degree Type, and Course Delivery Modality.
Consumer Awareness Information
The integrity of the institution assures its values of "Excellence, Respect, Responsibility, and Service".
LINK to Consumer Information webpage
LINK to Student Right2Know webpage
Specialized Program Level Student Outcomes
LINK to Department of Nursing Outcomes webpage
LINK to The Teachers College CAEP Outcomes webpage
LINK to the Counselor Education Outcomes webpage
LINK to the Athletic Training MS Program Outcomes webpage